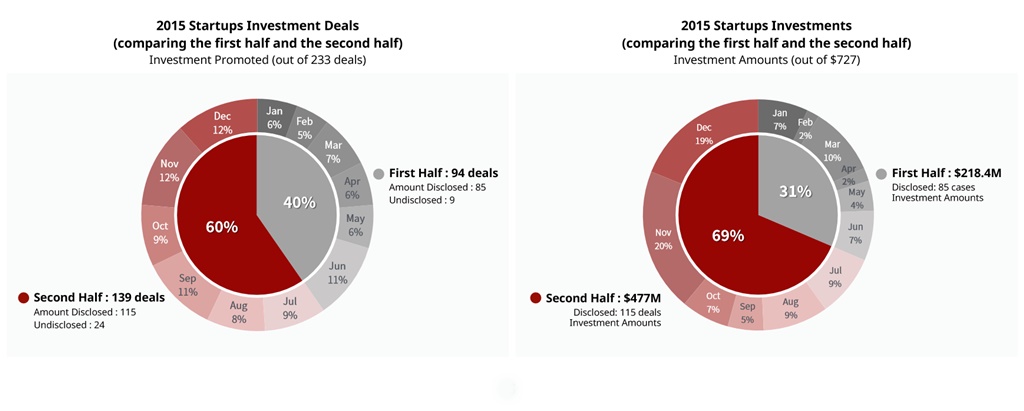
We publish research reports analyzing 2015 Annual Domestic Startups’ Investment Trends. The report summarizes the monthly investment trends, investments by scale, investments by business type/period, investor companies, and annual M&A status in 2015 based on publicly released 233 cases of startups’ investments, 40 cases of M&A information.
We hope this report helps readers understand domestic startups’ investment trends.
Basic Data Used in the 2015 Annual Domestic Startups’ Investment Trends Report
1. Number of Investment Promotion and M&A in 2015 : 273 (233 Promotions and 40 M&As)
2. Number of Startups Promoting Investment(Investee Companies) in 2015 : 210 (177 companies with full disclosure, 26 partial disclosure, and 7 nondisclosure of the amount)
3. Number of Businesses Involved in Investment in 2015 : 160 (with names released)
- * For companies promoted investment more than twice a year figures have been calculated based on the accumulative investment amount(including partially disclosed amount).
- * Investment scale graph is targeting the 184 companies with fully disclosed and/or partially disclosed amount only.
- * Assessment of business period has been calculated with Dec 2015 as an end date. * Most joint investors do not open their investment amounts, thus, only the numbers of investment participation and scale of investment have been applied.


댓글 남기기